Rising City Index · November 2026 all 1029 cities ×

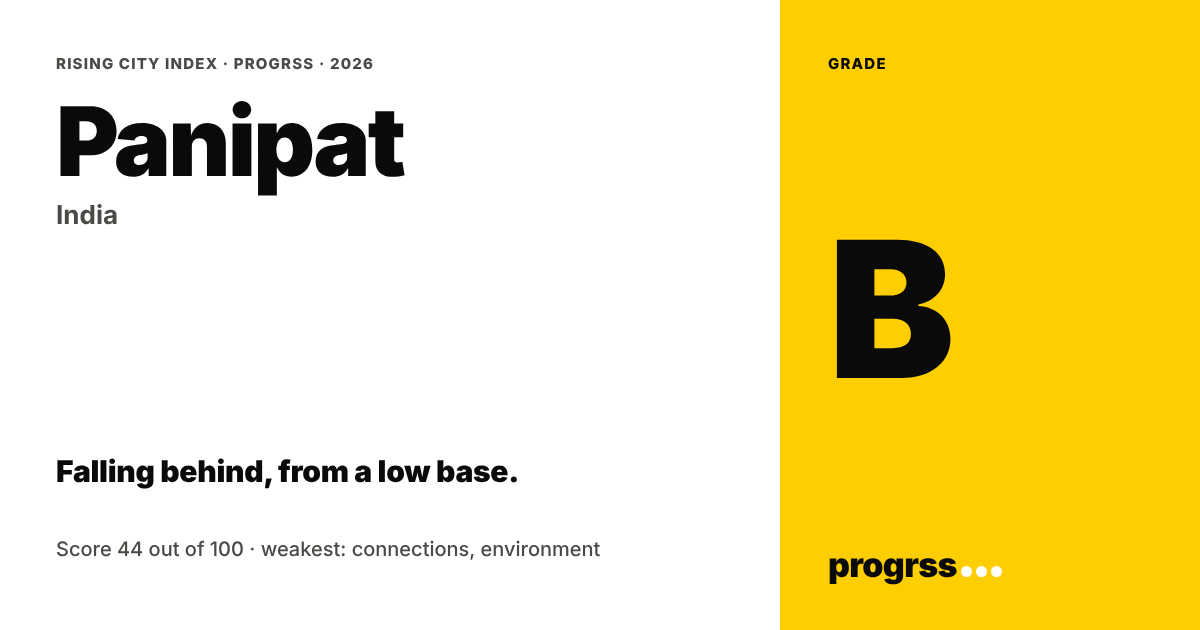
Panipat

India · 0.7 million people · =681 of 1029

Falling behind, from a low base.

Where it stands (2020–24 data)Low base
Light trendRising
Rising City Index grade B
37.8 out of 100Based on 6 of 6 forces
What this grade says

Panipat scores 37.8 out of 100 against fixed benchmarks. Strongest: economy and energy. Weakest: transport and environment. It starts from a low base (2020–24 levels). Night-time light has grown faster since 2022 than before.

Economy55

483rd of 1031 cities · rests on one measure

Connections45

646th of 1022 cities

Energy51

370th of 1032 cities

People31

529th of 1032 cities

Transport14

662nd of 948 cities

Environment31

681st of 1032 cities

The grade is the average of the six force scores, and can sit at most two bands above the city's third-weakest force. AAA and AA need all six forces scored.

How to read the table: every measure is scored from 0 to 100 against a fixed benchmark (the line under each measure), not against other cities. Adding cities never changes this score. Black bars = a score below 15.

MeasurePanipatScore against the benchmarkScore
Economy · 55 out of 100
Night-time light, 2015–250 = no growth · 100 = +10% a year (light ×2.6 in a decade) +70% 55
Research output, 2015–240 = no growth · 100 = output ×8 in a decade (+23.1% a year; set high because new journals entering the index inflate growth) · scored only with at least 100 works in 2015 not reported –
Income per person, 2015–20Context, not in the grade: its period ends in the COVID year (2020) +12% –
Connections · 45 out of 100
Fixed internet speed growth, 2020–230 = no gain · 100 = +50% a year · growth counted from at least 15 Mbps +84% 45
Air passengers, 2015–25Extra fact, not in the grade: no single worldwide airport source; filled as official files arrive not reported –
Internet speed reached, 2023Context, not in the grade: a level, not a change (it counts in “where it stands”) 131 Mbps –
Energy · 51 out of 100
Sun and wind added within 100 km, 2015–250 = none · 100 = 350 W per person per decade (the world average pace 2015–25, IRENA) 5.5 W per person 1
Clean share of new power within 100 km, 2015–250 = all new power nearby is fossil · 100 = all of it is clean (solar, wind, hydro, nuclear, geothermal); scored where at least 100 MW was built 100% 100
People · 31 out of 100
Population growth, 2015–250 = shrinking or flat · 100 = +3% a year +10% 33
Human development (region), 2015–200 = no gain · 100 = +0.008 a year · Regional figure: every city in the province shares this value. +0.012 30
Transport · 14 out of 100
Residents near public transport0 = 0% · 100 = 100% (UN target: everyone by 2030) 14% 14
Metro and rapid bus opened per million people, 2015–25Extra fact, not in the grade: no single worldwide metro source; filled as official records arrive not reported –
Environment · 31 out of 100
Land built vs people added, 2010–200 = land grows 2× faster than people · 100 = land grows at most 0.35 times as fast 1.11 (1 = land and people grow together) 54
Fine-particle air pollution, 2013–15 to 2021–230 = no fall · 100 = −8% a year (China's 2013–20 pace), or already at or below 5 µg/m³ (the WHO guideline) −10% 17
Greenness of built-up land, 2015–250 = −0.03 a decade (losing green) · 100 = +0.10 a decade −0.001 23
Weakest forces

transport · environment

Its two lowest force scores. Strongest: economy · energy.

Sources: NASA Black Marble · EU JRC GHSL Urban Centre Database R2024A (air, greenness, sprawl, human development, internet) and GHS-POP (people within 100 km) · UN-Habitat SDG 11.2.1 · OpenAlex · Global Energy Monitor · airport operators and aviation authorities · metro and transit operators. Mostly Estimates. Every score is measured against a fixed benchmark, not against other cities. Nobody can pay for or submit data to a grade. How the grade works
Measured, never opinion · every number traceable · nobody can buy a grade.

license the grades