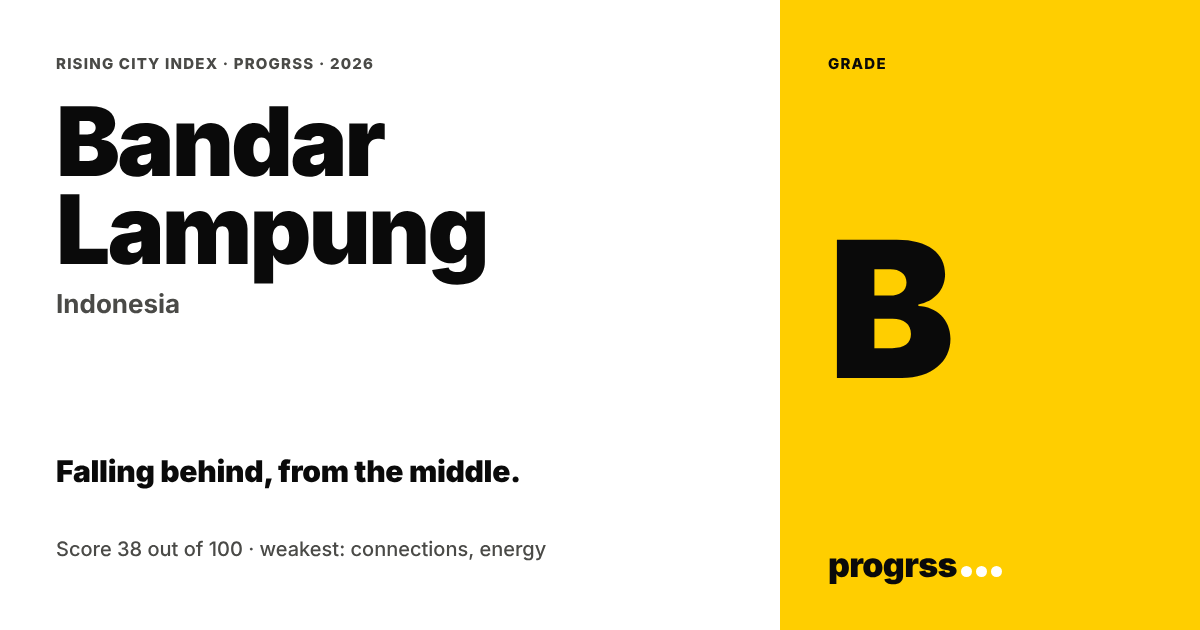
Bandar Lampung
Falling behind, from the middle.
Bandar Lampung scores 42.2 out of 100 against fixed benchmarks. Strongest: economy and connections. Weakest: energy and transport. It starts from the middle (2020–24 levels). Night-time light is still growing, but more slowly since 2022.
Economy75
230th of 1031 citiesConnections50
589th of 1022 citiesEnergy23
570th of 1032 citiesPeople37
458th of 1032 citiesTransport26
529th of 948 citiesEnvironment42
419th of 1032 citiesThe grade is the average of the six force scores, and can sit at most two bands above the city's third-weakest force. AAA and AA need all six forces scored.
How to read the table: every measure is scored from 0 to 100 against a fixed benchmark (the line under each measure), not against other cities. Adding cities never changes this score. Black bars = a score below 15.
energy · transport
Its two lowest force scores. Strongest: economy · connections.Sources: NASA Black Marble · EU JRC GHSL Urban Centre Database R2024A (air, greenness, sprawl, human development, internet) and GHS-POP (people within 100 km) · UN-Habitat SDG 11.2.1 · OpenAlex · Global Energy Monitor · airport operators and aviation authorities · metro and transit operators. Mostly Estimates. Every score is measured against a fixed benchmark, not against other cities. Nobody can pay for or submit data to a grade. How the grade works